Reporting & Analytics
Access all your salon reports — sales, finance, expenses, client insights, and team performance
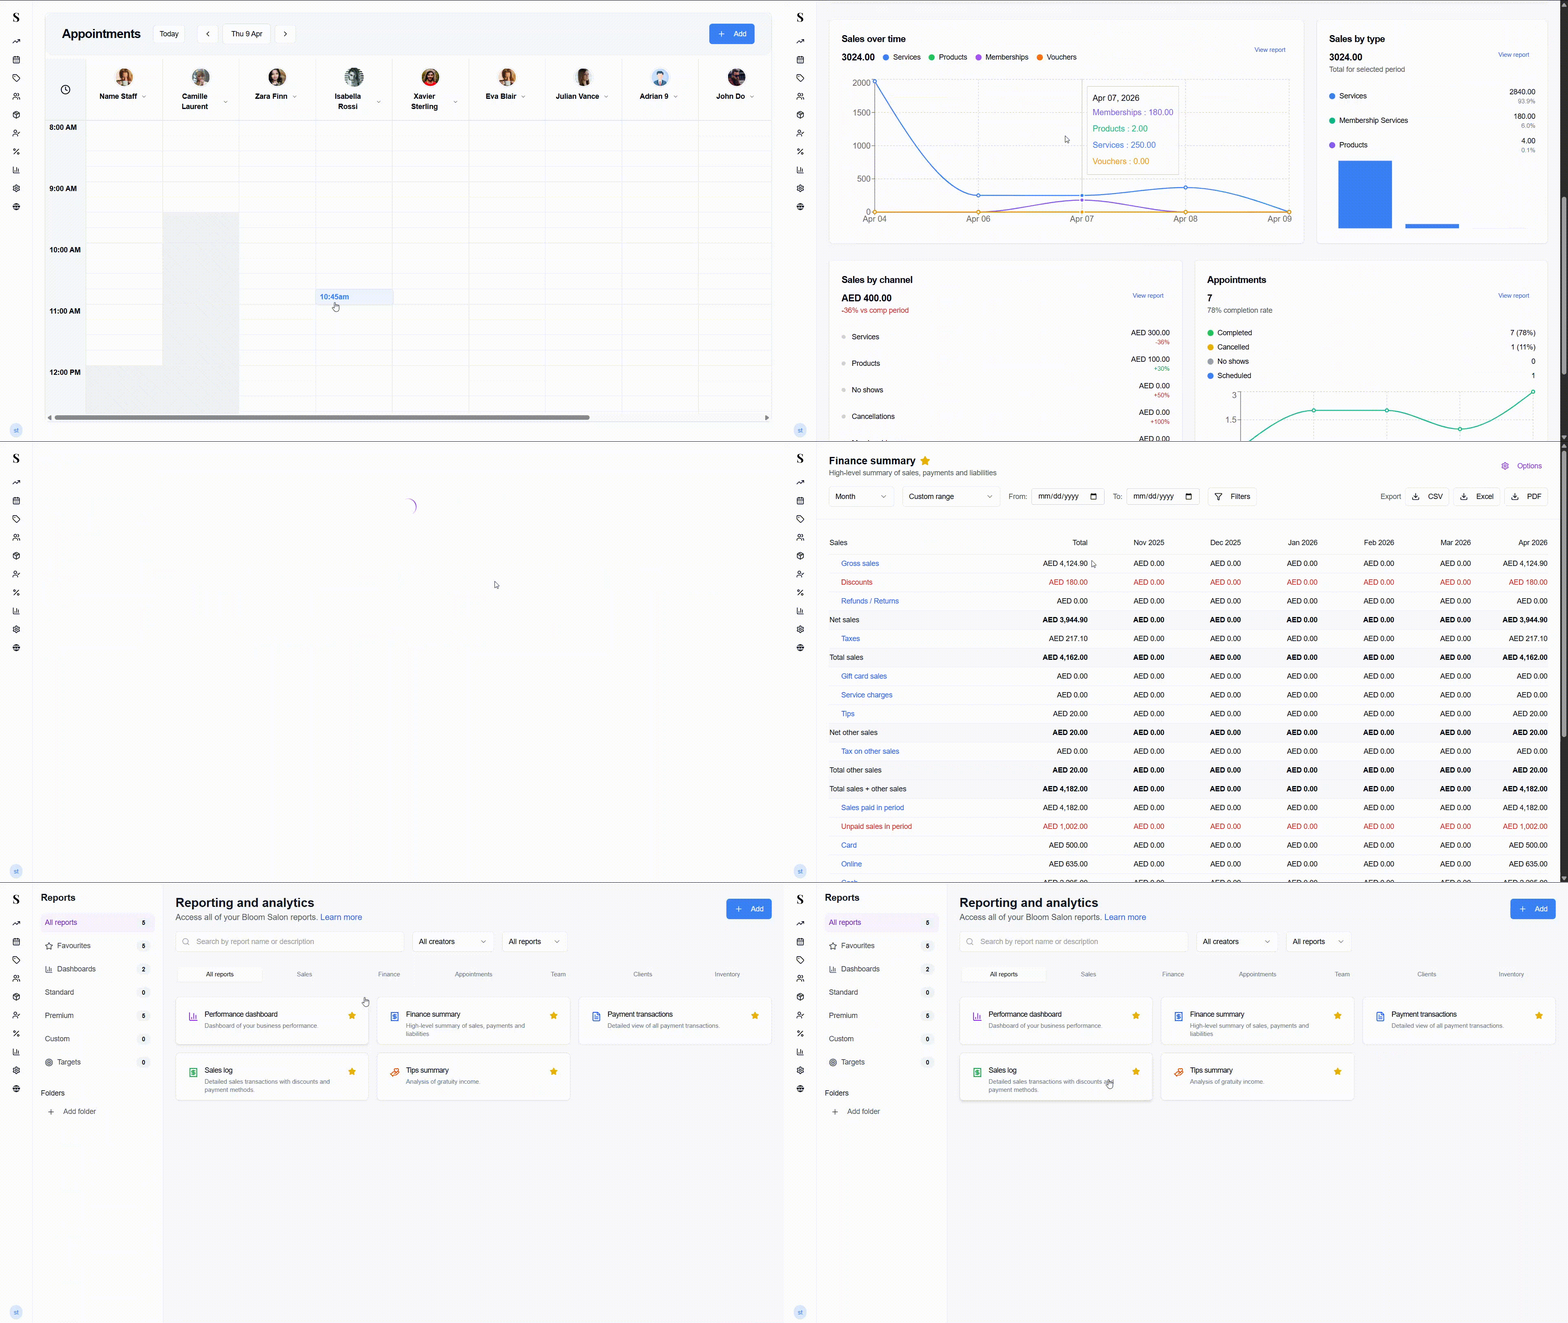
The Reports section gives you a deeper look at your salon's performance beyond the day-to-day. All reports are filterable, exportable, and organised by category so you can find what you need quickly.
Click Reports in the left menu to get started.
Reports are only accessible to admin users (or staff logins granted specific report permissions).
Finding a report
The main reports page shows all available reports as cards. You can:
- Search by report name or description
- Filter by creator using the All creators dropdown
- Filter by type using the All reports dropdown
- Browse by category using the tabs across the top: All reports · Sales · Finance · Appointments · Team · Clients · Inventory
The left sidebar organises reports into:
| Category | What is in it |
|---|---|
| All reports | Every report in one place |
| Favourites | Reports you have starred for quick access |
| Dashboards | Visual overview reports (e.g. Performance dashboard) |
| Premium | Premium-tier reports |
| Folders | Custom folders you create to organise reports |
Star any report card to add it to your Favourites.
Available reports
Performance Dashboard
(Dashboards)
A visual overview of your salon's performance. Shows key metrics, charts, and trends across revenue, appointments, services, and staff — all in one place.
Sales Log
(Sales)
A detailed record of every sale — including the services sold, discounts applied, payment methods used, staff member, and client. Use this when you need to trace a specific transaction or review sales over a period.
Filters: Date range, location, team member, client, payment method.
Export: CSV, Excel, PDF.
Sales Summary / Historic Data
(Sales)
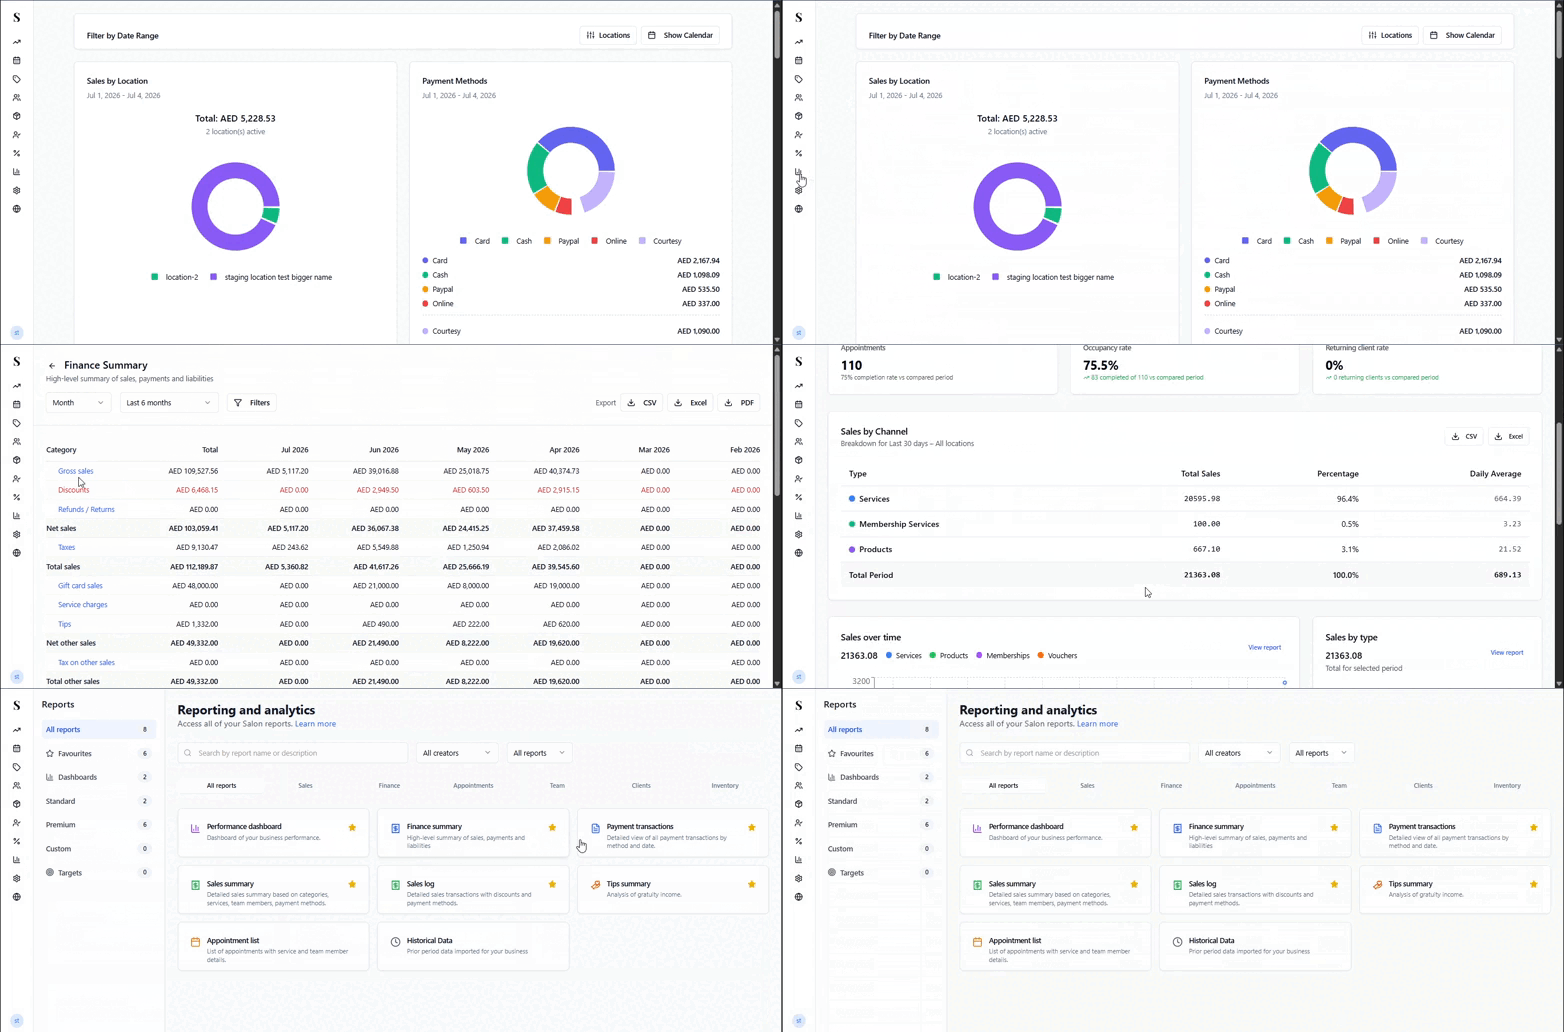
The Sales Summary gives you a high-level view of your salon's performance over time. Unlike the Sales Log which shows individual transactions, the Sales Summary aggregates your data so you can see trends at a glance.
What it shows:
- Total revenue by day, week, month, or custom period
- Revenue breakdown by service category
- Dedicated Tips column in both report view and export files for easy tip reconciliation
- Top-performing services and products
- Year-over-year or month-over-month comparisons
- Average transaction value trends
Use it for:
- Month-end reviews and reporting
- Comparing this month's performance to last month's
- Identifying your busiest days and slowest periods
- Spotting growth trends or seasonal patterns
- Informing staffing and inventory decisions
Filters: Date range, location, service category, team member.
Export: CSV, Excel, PDF. The PDF export includes formatted charts and summary tables suitable for sharing with accountants and stakeholders.
Use the Sales Summary alongside the Dashboard — the Dashboard shows you what is happening right now, while the Sales Summary lets you look back and analyse trends over any period you choose.
Daily Revenue by Service Type
(Sales)
Breaks down your daily revenue across each service category (e.g., Hair Cuts, Coloring, Manicures, Facials). This makes it easy to see which treatment categories drive the bulk of your income each day.
Filters: Date range, location, service category.
Export: CSV, Excel, PDF.
Finance Summary
(Finance)
A period-by-period breakdown of your sales, payments, and liabilities. Perfect for month-end reviews and accounting.
Choose how to group the data:
| Period | What you will see |
|---|---|
| Day | Last 30 days, one column per day |
| Week | Last 4 weeks |
| Month | Last 6 months (default) |
| Quarter | Last 4 quarters |
| Year | Last 3 years |
Export: CSV, Excel, PDF.
Expense Log
(Finance)
A dedicated report tracking all salon expenses logged through the POS — including internal supplies, refreshments, equipment maintenance, billable service items, and supplier inventory intake.
Filters: Date range, location, expense category, payment source (Cash, Card, Bank).
Export: CSV, Excel, PDF (formatted for easy handoff to your accountant).
Liability Report
(Finance)
Tracks your salon's outstanding financial liabilities. This monitors unredeemed prepaid membership sessions, active gift vouchers, and customer deposit credits.
Use it for:
- Knowing the exact monetary value of outstanding service sessions clients have already paid for
- Managing cash-flow risk and accounting reserves
Filters: Date range, location, liability category (Memberships, Vouchers).
Export: CSV, Excel, PDF.
Outstanding Clients Report
(Finance / Clients)
Lists all clients who have an outstanding balance on unpaid or part-paid visits.
What it shows:
- Client name and contact phone number
- Booking dates and services received
- Total amount invoiced, amount paid to date, and remaining balance owed
Filters: Date range, location, balance amount.
Export: CSV, Excel, PDF.
Payment Transactions
(Finance)
A full log of every individual payment collected. Use this to verify payment method totals or trace a specific transaction. The PDF export includes formatted tables and payment method breakdowns.
Filters: Date range, location, team member, payment method, transaction type, tip amount, amount range.
Export: CSV, Excel, PDF.
Tips Summary
(Team)
An overview of all tips received, broken down by staff member. Shows total tips, number of tipped transactions, average tip, and tip percentage for each person. You can also filter to show only tipped transactions using the tip filter.
Filters: Date range, location, team member, payment method, tips only.
Export: CSV, Excel, PDF.
Working Hours Report
(Team)
Monitors staff schedules, working shifts, total hours worked, and availability across all salon branches.
Use it for:
- Checking shift coverage and attendance
- Verifying hours before running payroll or commission slips
Filters: Date range, location, team member.
Export: CSV, Excel, PDF.
Insight Client Reports
(Clients)
Provides deep analytics for individual client profiles. Spot customer visit patterns, average spend, favorite treatments, preferred stylists, and rebooking frequencies to run targeted promotions and loyalty campaigns.
Filters: Client search, date range.
Export: CSV, PDF.
Favouriting reports (Heart icon)
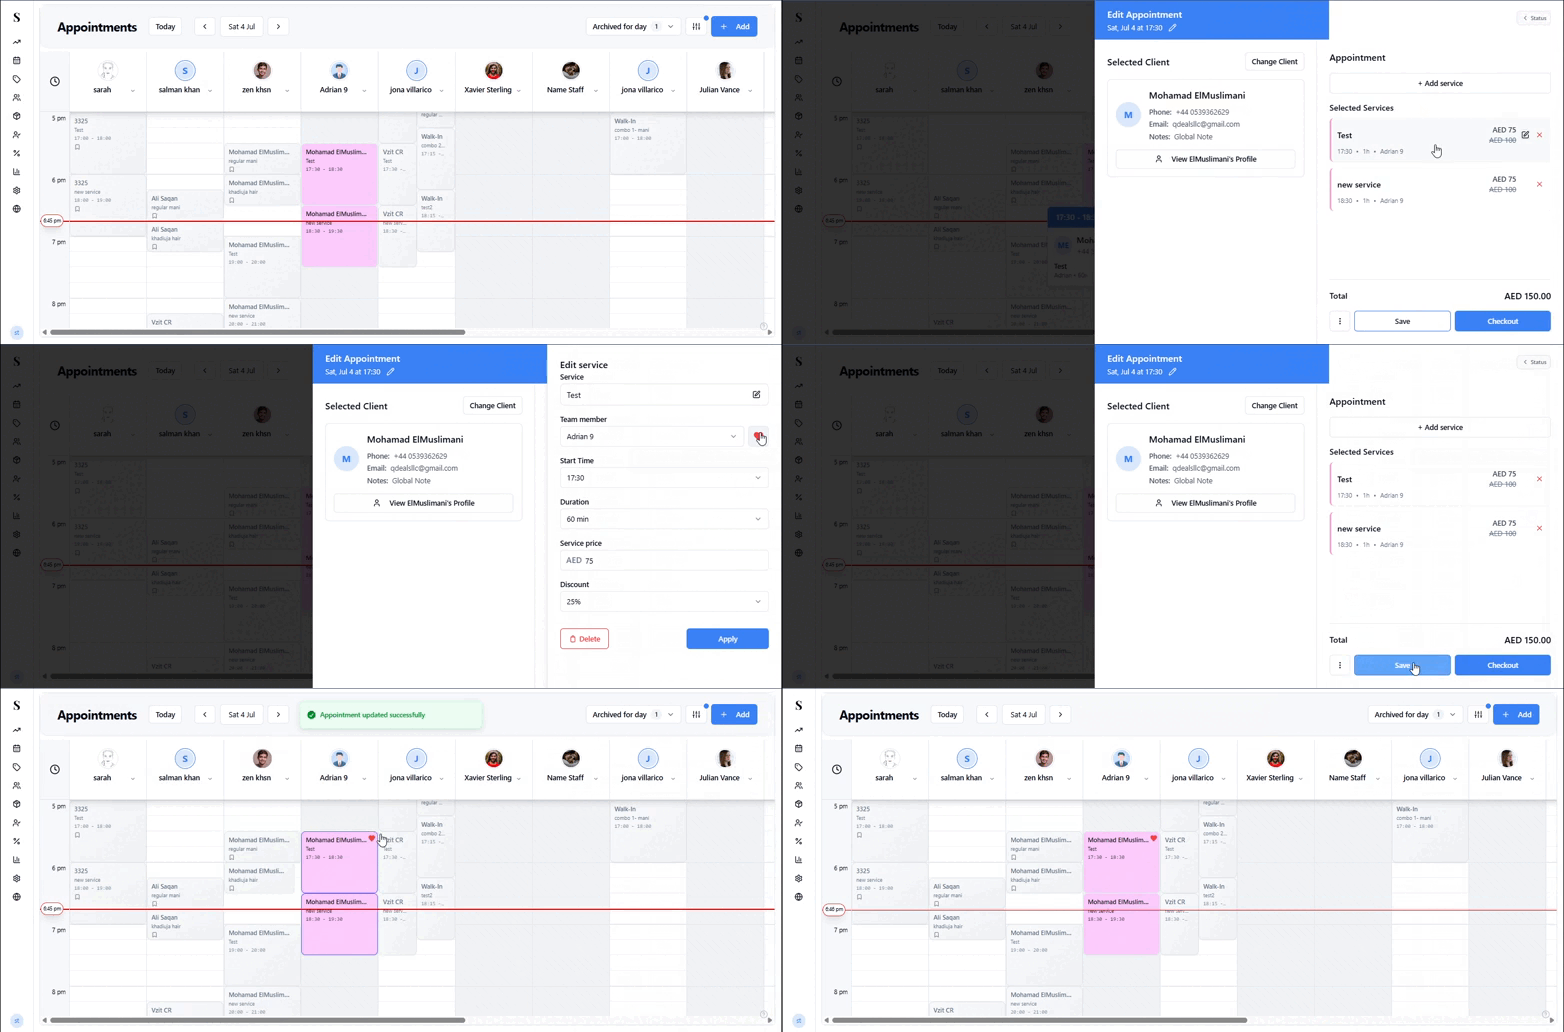
If you use certain reports regularly, you can favourite them for quick access. Favourited reports appear in the Favourites section of the left sidebar, so you do not have to search or browse for them every time.
Find the report card you want to favourite on the main reports page.
Click the heart icon on the report card. The heart fills in to show it is now a favourite.
The report now appears under Favourites in the left sidebar.
To unfavourite a report, click the heart icon again.
Favourite your most-used reports — like the Sales Summary and Finance Summary — so they are always one click away.
Export options
All reports can be exported in:
| Format | Best for |
|---|---|
| CSV | Importing into a spreadsheet |
| Excel (.xlsx) | A formatted, ready-to-share spreadsheet |
| Printing or sharing outside the system |
Date range options
All reports use the same date picker with quick presets:
- Today / Yesterday
- Last 7, 30, or 90 days
- Last week / Last month / Last 3, 6, or 12 months
- Week-to-date / Month-to-date / Quarter-to-date / Year-to-date
- Custom start and end date